Understanding Altair AI Studio
In this post we look at Altair AI Studio, formerly RapidMiner Studio, and see how you can use it to make more use of your data.
Altair RapidMiner is a term that covers many power data tools that can empower users to collect, process, and analyze large volumes of data. This can range anywhere from customer interactions to fault predictions in machines, and all of it can be incorporated into artificial intelligence (AI) within the tools. The specific tool we will be looking at today is Altair AI Studio (previously Altair RapidMiner Studio), which can be used to retrieve, organize, and clean data to prepare it for implementation in machine learning or AI. The software can then actually build, train, validate, and test these models all within the same user interface. On top of all of this, the software utilizes an extremely user-friendly drag-and-drop interface, allowing data scientists, engineers, administrators, or other users to design and build processes entirely without code.
 Fig 1. A display of a small subset of my completed Lego Sets
To showcase some of the capabilities of Altair AI Studio, I first need to provide a little background. I am an avid Lego collector, and I enjoy acquiring and building any new sets I can get my hands on. Recently, however, someone told me that Legos have the potential to be a better investment than Gold. I had a little trouble believing this, so I decided to do some research, but I quickly realized that this was no trivial task. I would need to collect all the information on Legos that I could get my hands on; this is where the power of Altair AI Studio begins to come into play.
 Fig 2. A sneak peek at some of the Lego sets in my building queue
First, I would need to acquire pricing information for as many Lego sets as possible, but this information is scattered across many pages of many different websites, and there are thousands of sets to identify. This would be a painstaking process to complete manually, but luckily the software can expedite this with a few simple clicks. I was able to find a website, brickeconomy.com, that has data on over 18,000 different Lego sets, covering decades of toy production. Each set listed on their website has information covering the release date, its retirement date (if applicable), the original retail price, and the current market price. This website does not have a consolidated list of Lego data, though, as each set is stored on its own unique URL. I utilized the sitemap to generate an XML file containing all the URLs on the website. From there, I converted the list of URLs to a *.csv file, where each row is one of the URLs on the website.
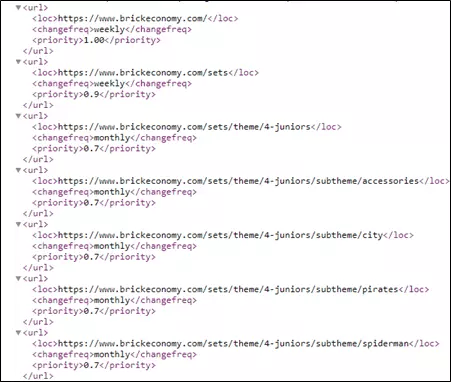
Fig 3. XML sitemap of data source
These steps can be completed in your preferred spreadsheet editor or directly within AI Studio. However, the following procedures are all completed within the tool. We can import the *.csv file into the software and store them as data, allowing us to retrieve them any time we need. Not all of the URLs in this list link to individual sets, though; some of them are for overall theme or year information, while others are general website links, like front pages, contact pages, or information for the currently logged in user. After a little examination, we can see that all the pages containing information for specific sets has “/set/” in the URL, so we can implement a filter in our model to extract only these URLs.
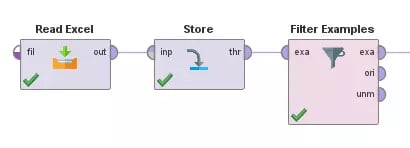 Fig 4. Reading, storing, and filtering URLs
Now, we can use the tool to extract the information from each URL of interest using the Get Pages block. This will automatically go through the entire list of web links and retrieve the HTML information for each page. The tool will automatically store each page as an Example in Data Table, but we will convert each Example to a Document for easier processing.
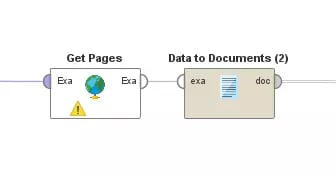 Fig 5. Retrieving and converting information from sites
From here, we can use the Process Documents block, which will allow us to define subtasks, in order to extract the necessary information. In this example, I first pull out the block of HTML that could possibly have all the datapoints I am interested in (release date, prices, etc.), and then I further cut that down to extract a single value for each parameter of interest. This process effectively generates a collection for us, where each entry has certain attributes. Some of these attributes are the values we manually extracted, and some of them are automatically collected, such as webpage loading time or the date-time of retrieval.
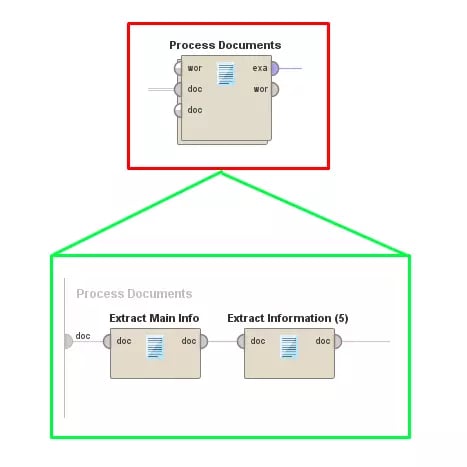 Fig 6. Processing site information into useable attributes
Since we are only interested in certain attributes from each entry, we can refine our results by using the Select Attributes operator to trim out unneeded information. You can think of this as deleted unwanted columns on a spreadsheet; all the rows are still there, but we only care about certain pieces of information on each row.
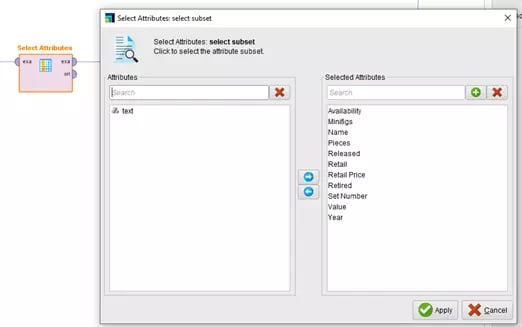 Fig 7. Isolating attributes of interest
Now we want to save our data to avoid any issues when it comes to processing the results. We can store it in our local database, similar to how we stored the URLs earlier, but I opted to save the results as an Excel Spreadsheet here. This will provide me the option to manually review the data in either Altair AI Studio or within Excel.
 Fig 8. Sample view of collected data and initially processed data
Upon inspecting the results, we will notice that some of the Lego sets are missing information, which means they will not be able to provide valuable results in the full-scale analysis. Luckily, we can filter those out by removing any entries that are missing attributes. We can decide which missing attributes are important enough to discount an entry or example from our dataset. For example, we definitely only want to include Lego sets that have known resale values and current market values, but we can retain examples if we are only missing either the full set name or full set number.
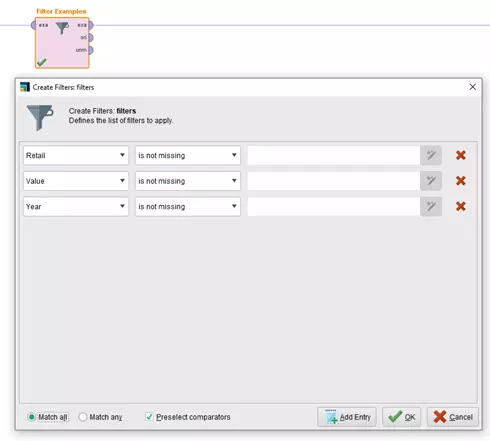 Fig 9. Filtering to only include valid data
There are many options on how to proceed from here, but I want to examine the compound annual growth rate (CAGR) for sets that are retired. In the context of Legos, this means I am only interested in sets that are no longer manufactured by Lego and are only available in the resale market. To accomplish this, I will further filter my results to only examine examples that have an attribute “Availability” equal to “Retired.”
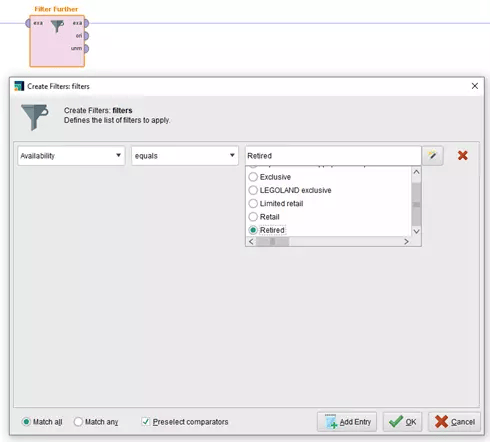 Fig 10. Filtering further to look at Lego sets of interest
Now I can calculate the CAGR by using the formula below, where n is the number of years since retirement. Again, this can be directly completed with Altair AI Studio by adding a new calculated attribute to each example in the dataset.
We are finally ready to view the results of the analysis. We have a multitude of options for visualizing results within the tool, including a variety of scatter plots, bar charts, and distributions. We can look at the overall average of CAGR, we can analyze by release year, or we can examine the combined effects of various attributes on the overall growth.
 Fig11. CAGR statistics
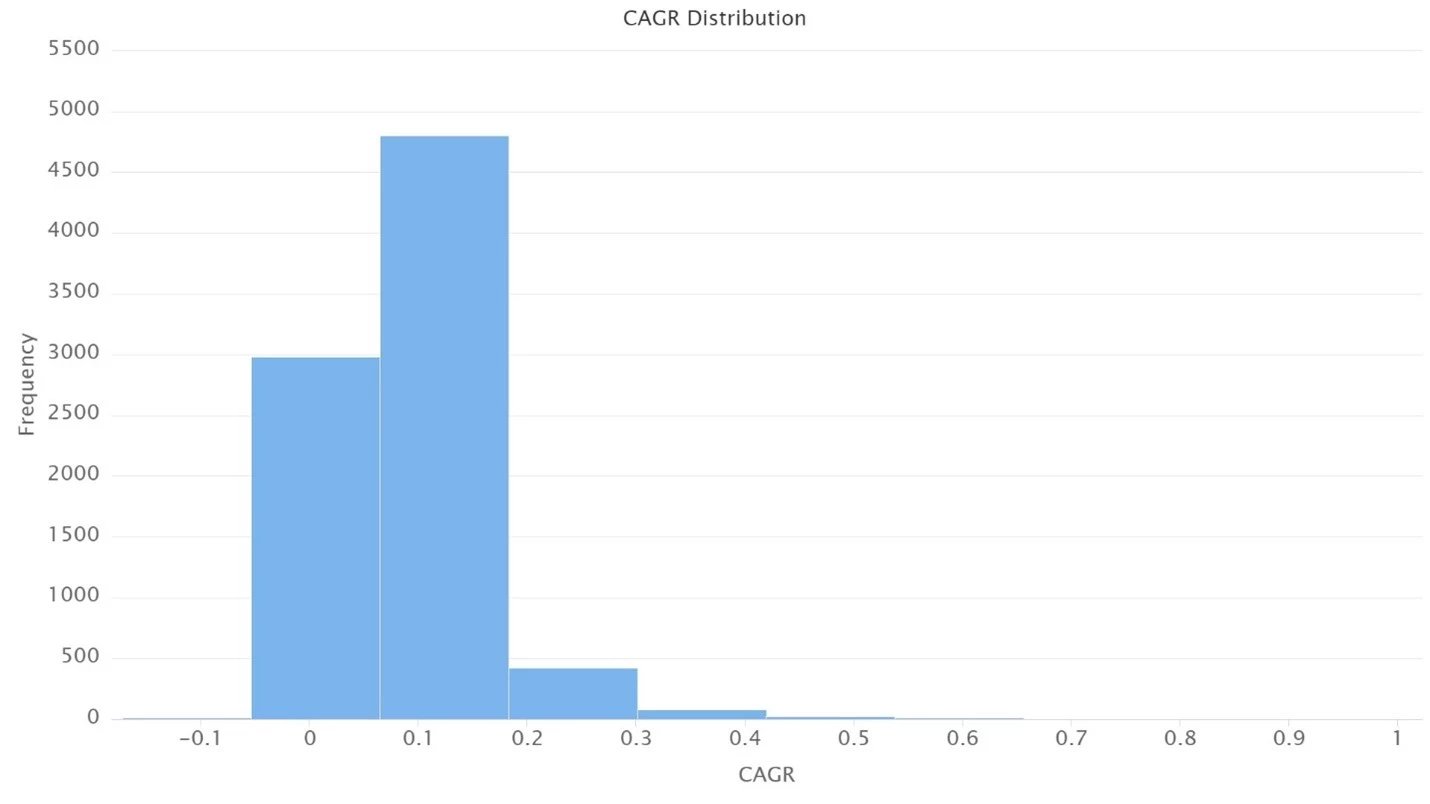 Fig 12. Distribution of CAGR
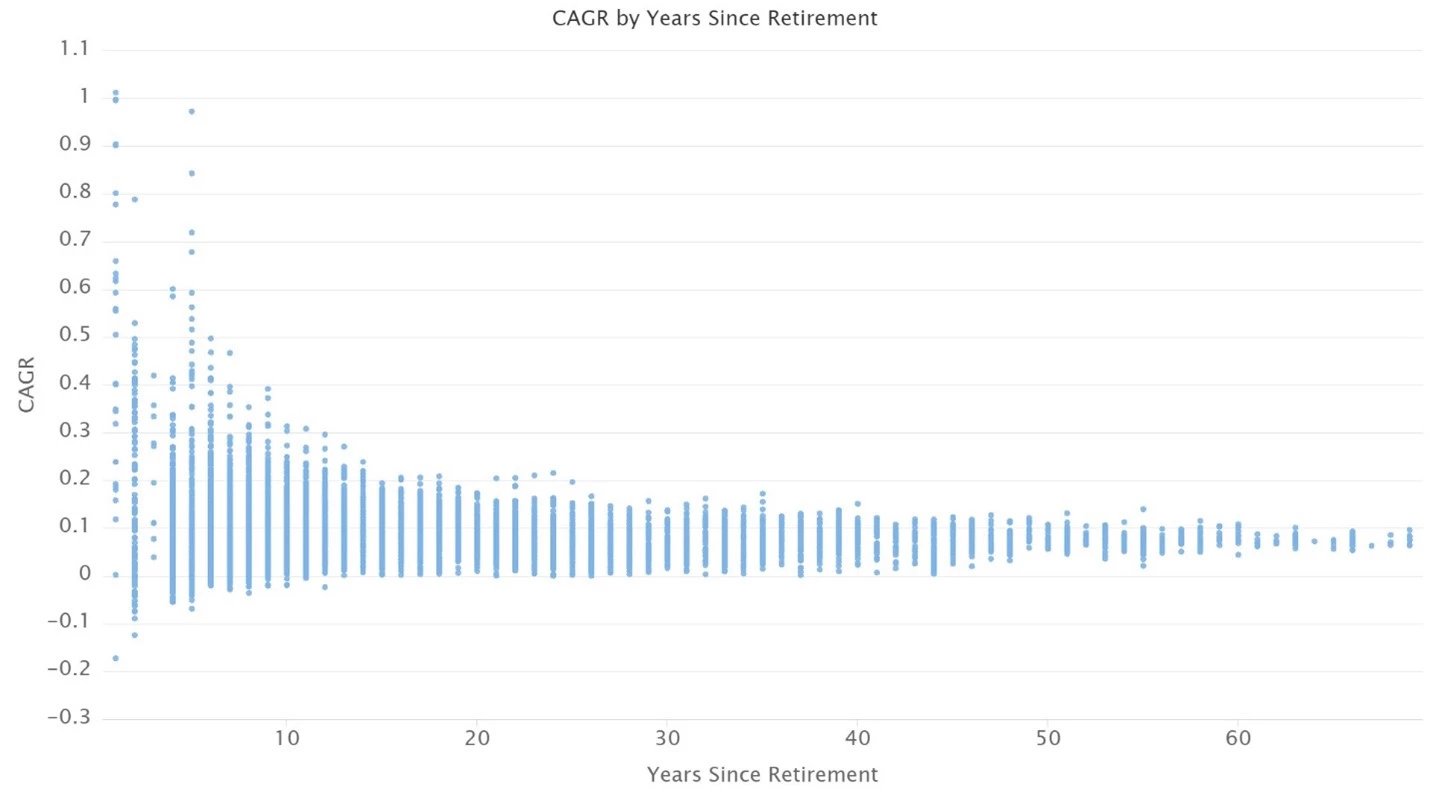 Fig 13. CAGR scattered with respect to number of years since release
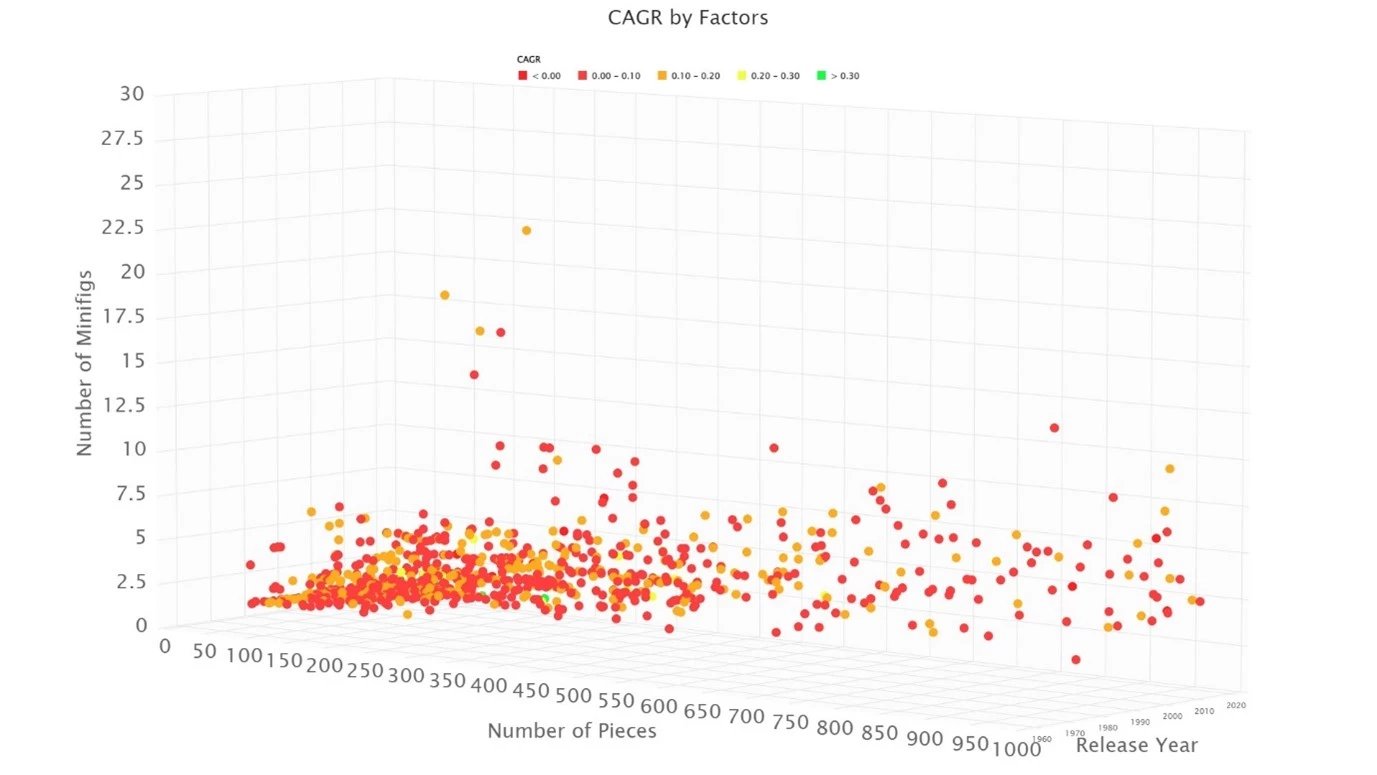 Fig 14. CAGR as function of number of pieces, number of minifigs, and release year
This example has not only shown us that Lego might not be such a bad investment (if you can resist the temptation to build the sets after buying them), but it has also shown us the incredible power of Altair AI Studio when it comes to retrieving, preparing, and analyzing large sets of data. There are endless possibilities to continue this project, others like it, or something entirely new within the software. Be sure to check back here or on our YouTube channel for more content like this, or feel free to reach out to us directly with any comments or questions!
