
RFID in Marathon Running: Simulation with Altair FEKO
With the recent conclusion of the Summer Olympics and Paralympics in Paris, there is still much to discuss and analyze. One very interesting aspect of both sets of games is the use of highly sophisticated technology to ensure fair and accurate scoring across the board. A great example of this is the use of RFID (Radio Frequency Identification) armbands in racing events. RFID has a wide variety of uses ranging from access control to inventory and asset management through their ability to transfer data without physical contact.
There are two main types of RFID: passive and active. Passive RFID does not need an internal battery, as it relies on external and wireless power sources instead, such as loss prevention detection in stores. Active RFID does have an internal battery, allowing it to communicate over a wider range while also increasing the variety of applications. Referring to the Olympics and the Paralympics, active RFID is heavily used to track the exact location of athletes in events where the difference between fractions of a second can make the difference between gold and silver medals. In the Olympic Marathon, for example, these RFID armbands can ensure racers stay on track and provide accurate results for the total amount of time spent racing.

Fig 1. Examples of RFID technology in use for athletic competitions.
With this in mind, engineers might wonder what one of the best ways to approach designing this technology might be. That is where the power of Altair FEKO comes into play. FEKO is Altair’s solution to high-frequency device design, analysis, and optimization. Users can use the CAD interface to design parts from scratch, import existing geometries, or use pre-made templates and macros to expedite the design process. From there, simulation results range anywhere from S-Parameters to three-dimensional field results.
To begin the process of modeling an RFID tag in FEKO, we will first define the material used to make the substrate of our device. We can create a new dielectric material and define its material properties, allowing us to use it in our 3D design as we need it.
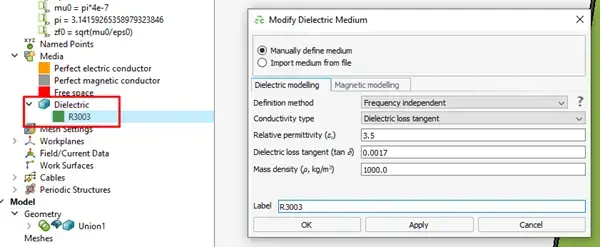
Fig 2. Defining custom dielectric material in FEKO.
From there, we will begin by creating the geometry to represent the conductor on the device. For this example, we will use a meandered dipole, which will allow us to create the antenna within a much smaller footprint. We will use the Construct tools within FEKO to begin creating one arm of the rectangular meandered dipole, as shown in Figure 3 below.
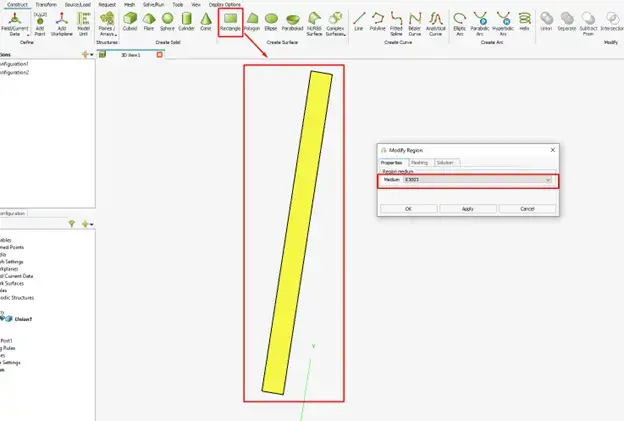
Fig 3. Adding 2D geometry in CAD interface.
After that, we will add a short horizontal leg to allow us to actually “meander” the antenna back and forth. Again, we will use the Construct tools to generate this portion of the device. Figure 4 shows the current progress after the initial creation of these first two rectangles.
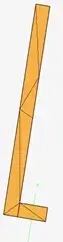
Fig 4. Extending 2D geometry in CAD interface.
We are now at a point where we can continue the creation of the geometry more quickly by using the duplicate and transform options within FEKO. This allows us to copy and move parts of the geometry to create larger structures with repeating patterns. It also ensures that the geometry remains consistent throughout the device. Figure 5 below shows the entirety of the meandered dipole after some additional rectangles have been added.
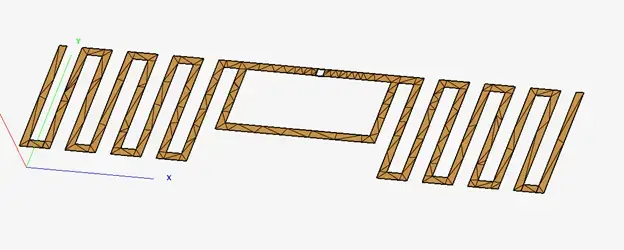
Fig 5. Completing more elaborate 2D geometry in CAD interface.
Next, we are ready to add the substrate to the model that will represent the surface of the RFID tag that the antenna will sit upon. Again, we can do this relatively quickly in FEKO by adding a cuboid to the model, providing its size and location, and defining the material as the dielectric we created earlier. Figure 6 below shows an almost complete model.
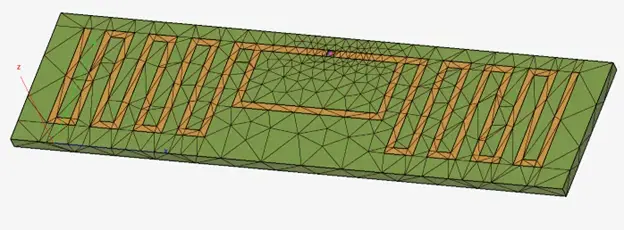
Fig 6. Adding 3D substrate composed of custom material in CAD interface.
The final step before we actually run the simulation is to add the port with the source and load of our active RFID circuit. For this example, we can add a wire to the small gap in our meandered dipole, which will then allow us to add our voltage source and load, as shown in Figure 7 below. The source and load parameters are determined in this example by the desired frequency of 915 MHz for our device.
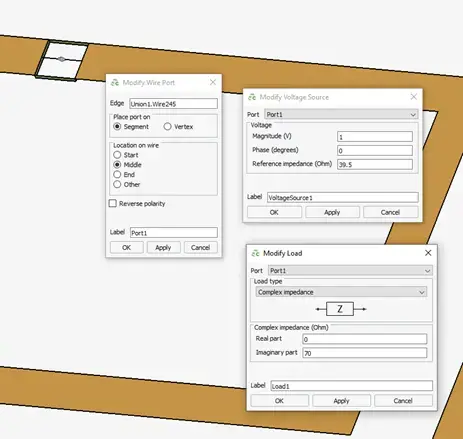
Fig 7. Defining electrical parameters of source and load in model.
After simulating our model, we have the ability to display a wide variety of results. For example, we can look at the magnitude, phase, real component, or imaginary component of the reflection coefficient, voltage, current, Voltage Standing Wave Ratio (VSWR), power, and other parameters. Figure 8 below shows how to display the reflection coefficient over a range of frequencies in dB.
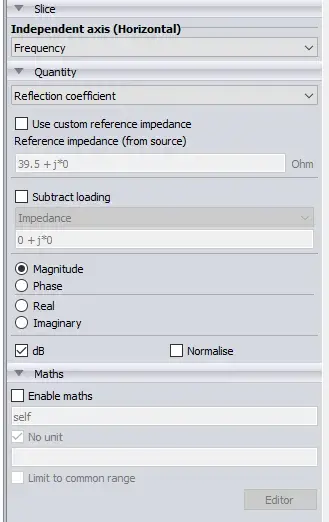
Fig 8. Customizing view of plotted results.
We can view several different sets of results in one post-processing session to gain a more complete understanding of the device we have designed. For example, the following images show the reflection coefficient, source power, and load voltage over a range of frequencies around our operating point. We could use this information to decide if our device is functioning as intended, or if we need to make further modifications to improve the results.
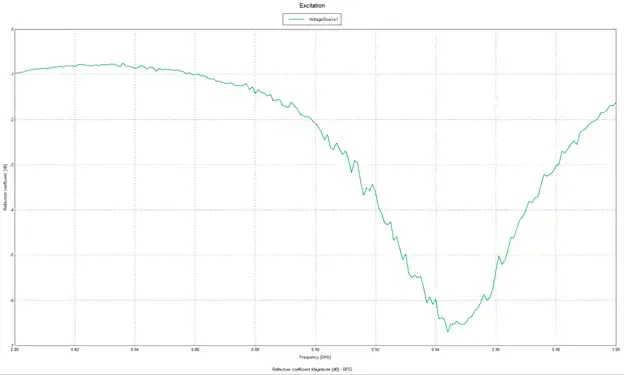
Fig 9. Reflection Coefficient of RFID device over range of frequencies.
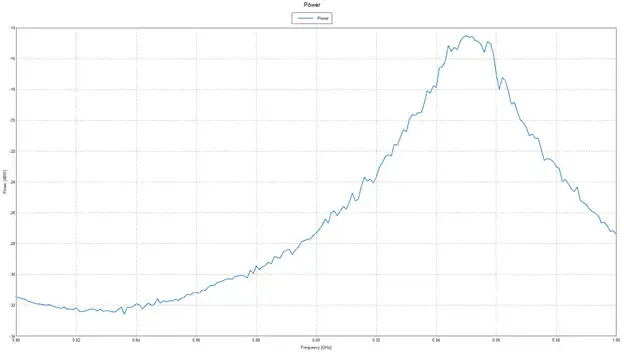
Fig 10. Source Power in RFID device over range of frequencies.
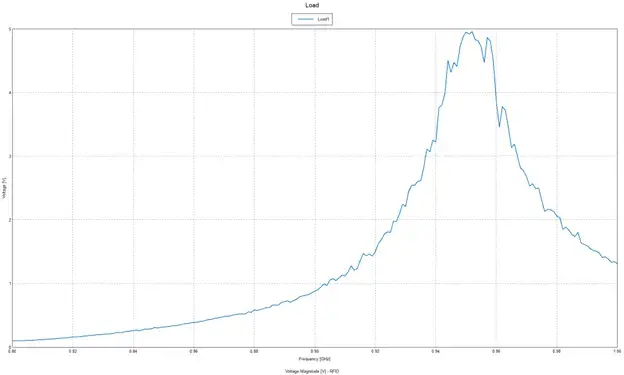
Fig 11. Load Voltage of RFID device over range of frequencies.
FEKO can do more than just plot results on a cartesian plot, though; we also have the ability to display a range of results in three dimensions. For example, Figure 12 below depicts the total gain of our device at our operating frequency of 915 MHz. This interface allows engineers to manipulate their model in 3D and see the full range of electromagnetic results in relation to the actual geometry of the device.
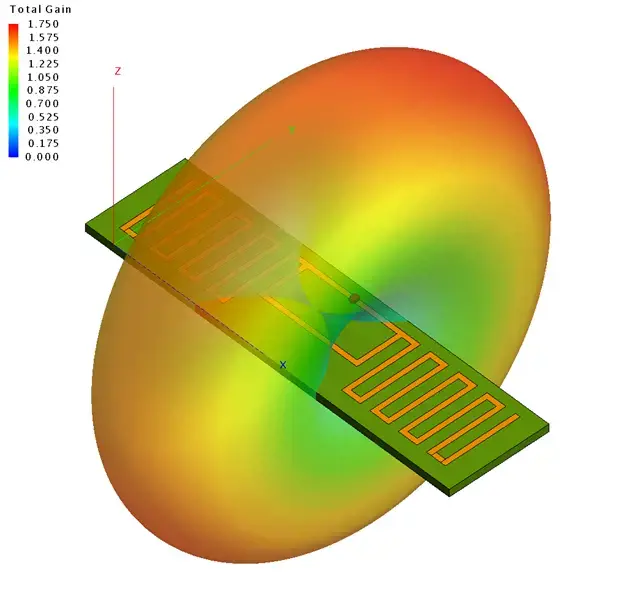
Fig 12. Far Field Gain results of RFID device at operating frequency of 915 MHz
FEKO also provides a way for us to understand the strength of the device at certain distances. We can view the near field results of the electric field around the RFID tag to see which directions the signal is strongest, and how far from the antenna we can go before the signal strength diminishes. This example is highlighted in Figure 13 below, which shows the electric field just below and around the device. If we so desired, we could take this a step further in a companion tool called WinProp, which would allow us to analyze the wave propagation in a custom indoor or outdoor environment.
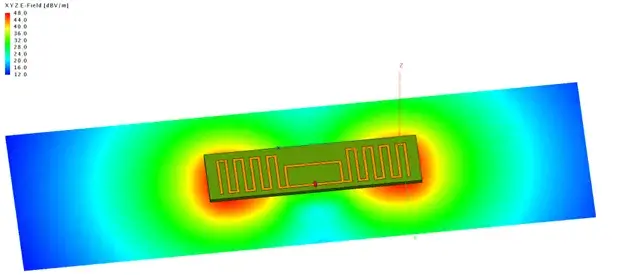
Fig 13. Near Field Electric Field results of RFID device at operating frequency of 915 MHz
This brief overview of RFID design and analysis in Altair FEKO is just the tip of the iceberg when it comes to 3D electromagnetic simulation. There are countless other ways to customize, analyze, and improve the design of our high-frequency devices using this tool. This demonstration has shown that even Engineers for the Internal Olympic Committee may be able to expedite their design process in real-world applications, so FEKO can definitely assist in a wide assortment of electrical and radio-frequency applications. For more content like this, please be sure to routinely visit our blog and subscribe to our YouTube channel. As always, feel free to reach out with any questions or comments you may have!