
Predicting Olympic Basketball Medals using RapidMiner
In this post we use past Olympic Basketball data to see if we can figure out which statistics are most viable when predicting who will win the Gold.
With the ongoing 2024 Summer Olympics in Paris, there is a much global interest in who will take home the gold medal in a wide range of sports. When it comes to the Men's basketball, Team USA is typically seen as the favorite to win, but results over the last decade has shown that many countries are catching up, and this might be one of the most competitive tournaments ever. There are many factors that go into determining who will end up on the podium at the end of an event, but is there any way to reliably predict these results? That is exactly what we will take a look at today with the power of Altair AI Studio, which is a data acquisition, cleansing, and modeling tool in the Altair RapidMiner suite of data science software. Specifically, we will be taking a look at what factors influence a country’s chance of earning a top spot in Olympic Basketball.


One great thing about basketball is the sheer volume of data we have available. In addition to games played and medals won, we can also access a wide variety of statistics, such as field goals, three-pointers, two-pointers, free throws, rebounds, and more. Thankfully, there are many online resources that have already compiled all of this data, such as Basketball Reference. Figure 1 below shows some of the high level data available for each year Olympic Basketball on this website. It displays the teams in contention, their win-loss ratios, number of games behind, number of points scored per game, and number of points allowed per game. Additionally, we can see which country won each medal.
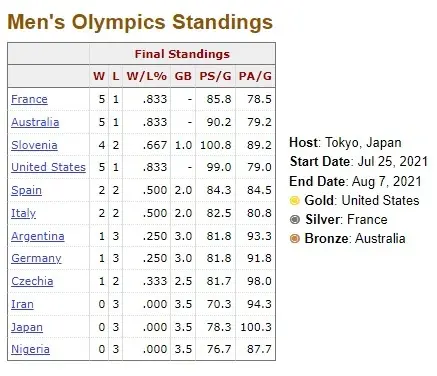 Fig 1. Example of Olympic overview data.
We can also access a finer level of statistics for each competing team each year on the same website. This includes information on field goals, three-pointers, two-pointers, free throws, rebounds, assists, steals, blocks, turnovers, fouls, and total points. Figure 2 below shows an example of this data for the 2020 Tokyo Olympics.
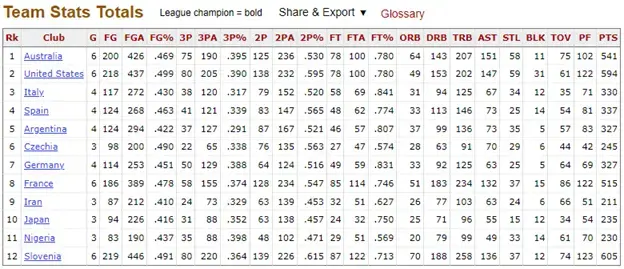 Fig 2. Example of Olympic team statistics.
We will use AI Studio to query the various pages and tables housing this information. We will use the “Crawl Web” operator to access all of the related pages. This will allow us to automatically pull all pages of interest without needing to know the exact URL ahead of time. We will start our web crawl on the “home page” that has direct links to all previous Olympics and the basketball information that was shown above. However, there are also several other links on this “home page” that go to other pages that we are not necessarily interested in, such as non-Olympic matches. Therefore, we can set our crawling rules to only follow and store links that meet specific criteria. In our case, we want to follow links that contain “Olympics,” as this will direct us to the relevant information for this project. Figure 3 displays an example setup of this operator, with the crawling rules defined as a regular expression (or REGEX).
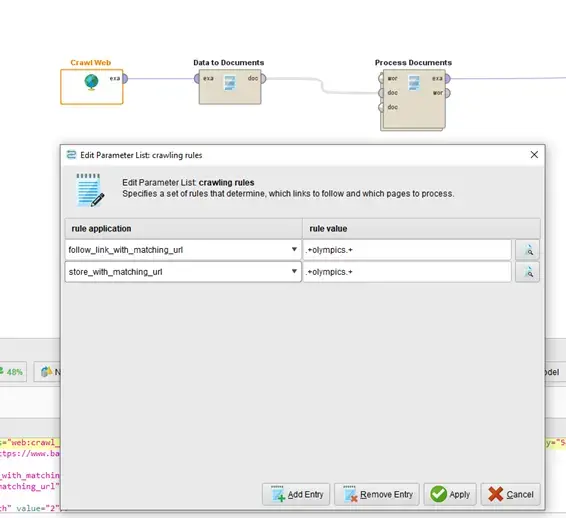 Fig 3. Use of Web Crawler operator to identify and extract relevant information.
We will then continue to process the “crawled” web pages to extract the exact information that we need. We can do this with a combination of the “Data to Documents” and “Process Documents” operators. This will allow us to convert the webpages to a more readable format in AI Studio and generate examples and attributes in our dataset. For a more detailed step-by-step guide of this process, be sure to check out one of our previous blogs: Understanding Altair AI Studio. After this pre-processing is complete, we end up with a set of data similar to what is shown in Figure 4. This includes the year and competing countries for each of the Olympic competitions since 1988, as well as their medal placement, field goal percentage, three-point percentage, two-point percentage, and free throw percentage. Percentages were chosen over raw totals, as some teams played more games than others, which could result in skewed data.
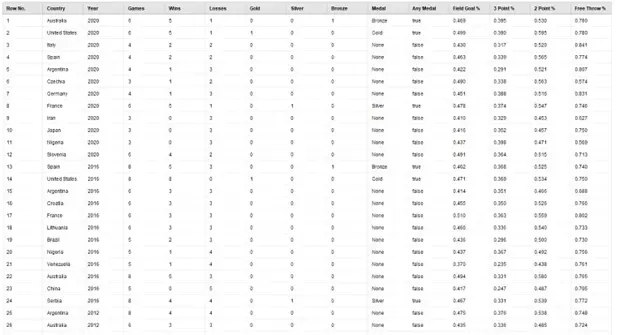 Fig 4. Output of data acquisition, including all attributes of possible interest.
Once we have our data tabulated in AI Studio, we will import it into the Auto Model module, which will allow us to quickly generate and compare several predictive models. Since the size of Olympic winners is relatively small compared to the size of overall competitors, it will most likely be difficult to predict the exact medal placement. However, we can attempt to predict whether a team earns any medal or not, which is represented by the attribute “Any Medal” in our dataset. A value of TRUE indicates that a team won a gold, silver, or bronze in that specific year, while a value of FALSE indicates that they did not win any medal that year. The selection of this column as our prediction output is shown in Figure 5.
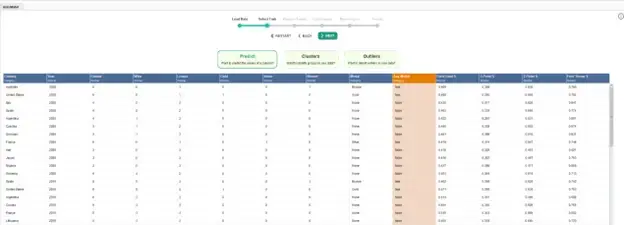 Fig 5. Preparing Auto Model by selecting model type and model output.
Next, we see the distribution of values in our prediction. Again, we can see that there are many more team-year combinations that have not won any medal, which is expected, due to the fact that there are only three medals awarded each year. We can rename our classes from “false” and “true” to “No Medal” and “Won a Medal” to increase readability of our results, as shown in Figure 6.
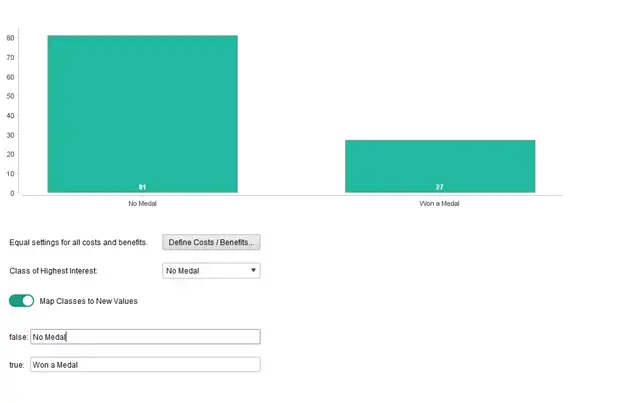 Fig 6. Distribution of output class in predictive model.
The next step of the Auto Model capability is to select the attributes that we would like to consider as inputs to our model. For this example, we only want to consider the percentage of successful field goals, three-point, two-point, and free throw attempts. Some other attributes might more directly influence the outcome, such as games played or number of wins, but we are going to exclude these values, as we are trying to make predictions as if the games have not been played yet; for this reason, we only want to consider the overall success of the team on the basis of the success ratio of the various scoring opportunities in the sport. Similarly, we will exclude the year, country, and exact medal won, as we are interested in a general model to predict the chance of medaling at all. Figure 7 shows the panel where we can select the attributes to consider, which also has a color indicator of what the software deems to be a “good” or “bad” input attribute (red, yellow, and green correspond to poor, medium, and good, respectively).
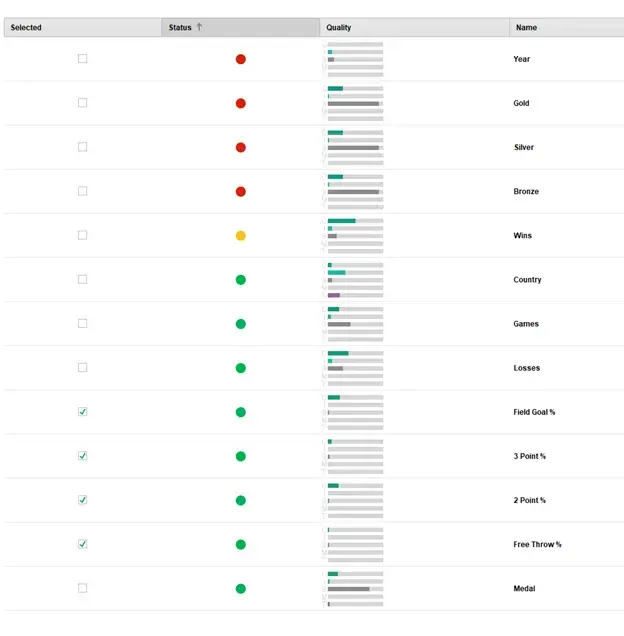
Fig 7. Selection of inputs to predictive model.
Once we have selected the inputs and outputs, we will run the Auto Model tool, which will automatically train several model types, including a Naïve Bayes, a Generalized Linear Model, Deep Learning Model, decisions trees, and more. After training is complete, we see an overview comparing the prediction error, training speed, and testing speed of each model, as shown in Figure 8. We can use these performance metrics to decide if we would like to pursue a specific model any further or implement it in a production environment.
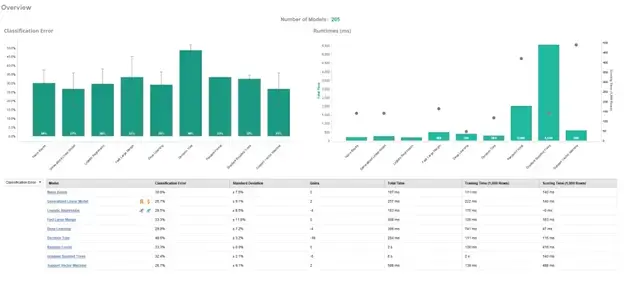 Fig 8. Overview of predictive model comparison.
In this example, the Generalized Linear Model had the lowest classification error and a very good speed, so we can investigate it further. Figure 9 below shows the exact results of the model for its predictions on each input. We see what the predictions were, how confident the model was, how the inputs affected the outputs, and whether it was correct or not.
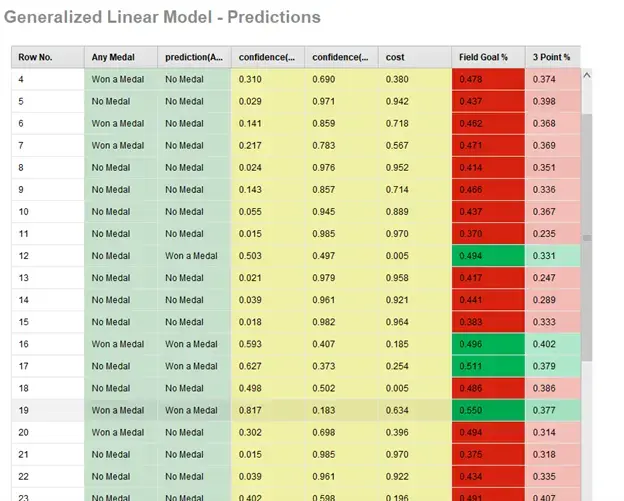 Fig 9. Example of model predictions, confidence, and results.
We also have the ability to generate a Confusion Matrix displaying the results of each model at a higher level, shown Figure 10. A Confusion Matrix is use in classification problems, as it shows the number of predictions in each class compared to the true number of examples in each class. In this case, we see that the model did quite well at predicting “No Medal” 19 times accurately, with 6 incorrect predictions for examples that did actually win a medal. However, there is more room for improvement on predicting “Won a Medal,” which is unsurprising given the relatively small dataset.
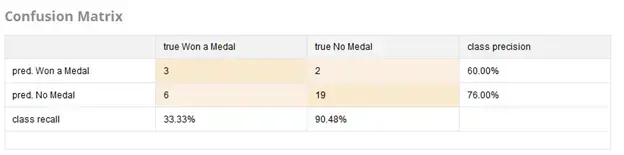 Fig 10. Confusion Matrix of predictive model results.
We also have the ability to examine the data in various formats to attempt to identify any obvious trends. For example, Figure 11 displays the scatter matrix for our dataset. With this visualization, we see how the combinations of our various inputs impact the outputs. The green dots indicate that no medal was won, while the blue dots indicate that a medal was awarded. Based on this matrix, it appears that field goal and two-point percentage have the strongest correlation to winning a medal.
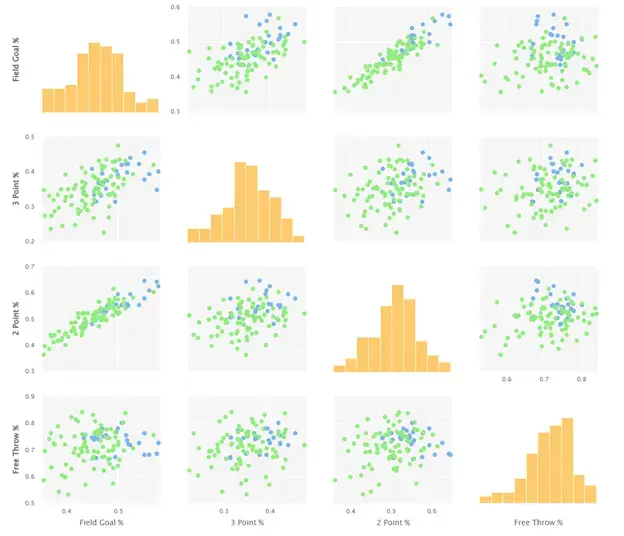 Fig 11. Scatter Matrix displaying relationships between various inputs and outputs.
We can further analyze this correlation with a scatter-bubble plot of these two attributes, shown in Figure 12. Again, green dots indicate that no medal was won, while the blue dots indicate that a medal was awarded, but we have also added the size of the bubble as an indicator; the larger the bubble sizes indicate a higher three-point percentage.
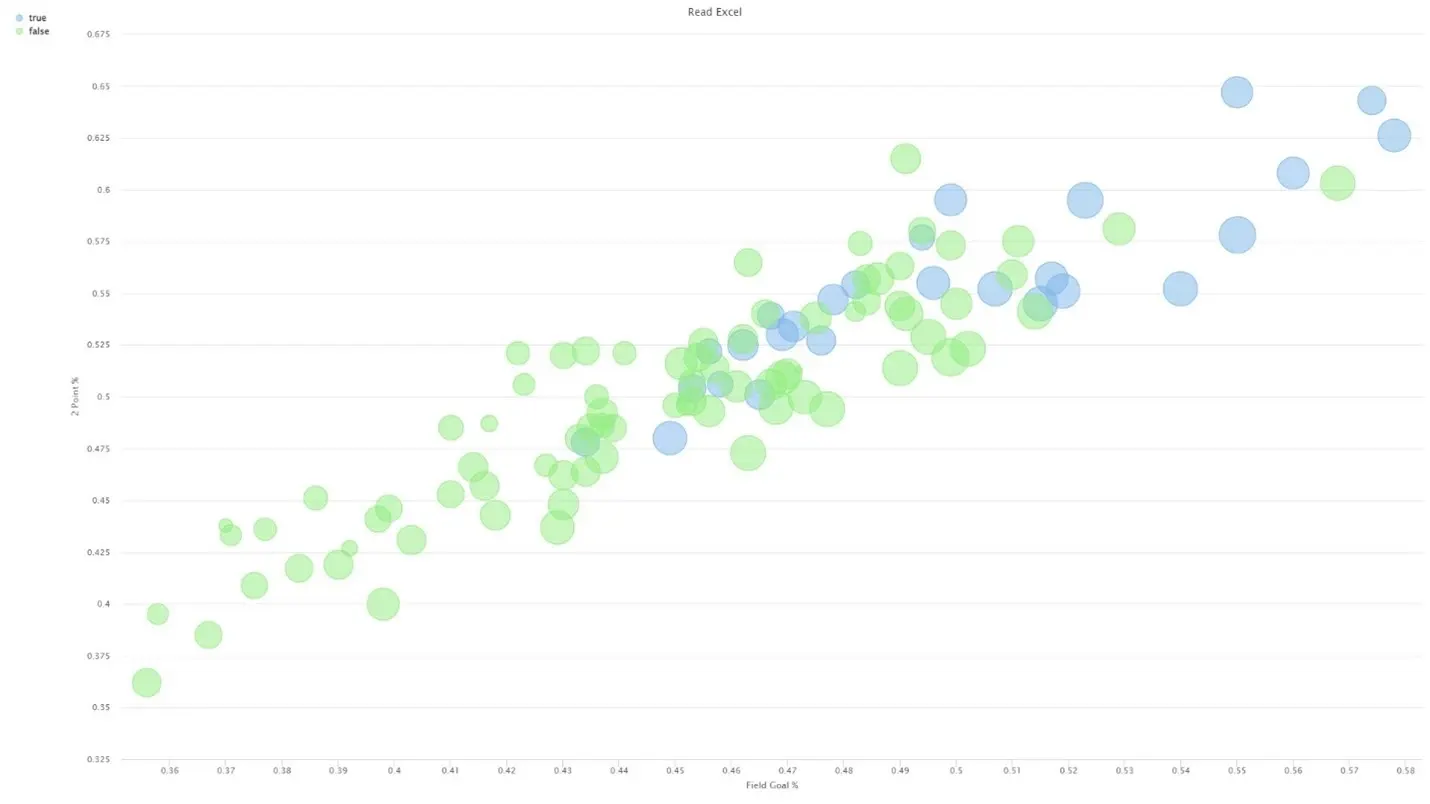 Fig 12. Customized Scatter Bubble plot of possibly strongest correlation in the dataset.
It is difficult to say exactly how much of an impact the three-point percentage has on medaling using this plot, so we will generate a correlation-weight table, shown in Figure 13. This will provide a quantifiable relationship between each input and output. In this case, we can see that our earlier expectations were verified, with field goal and two-point percentages having the strongest correlation to receiving a medal. There is still a somewhat significant weighting of three-point percentage, but the free-throw percentage has a surprisingly weak effect on the overall results.
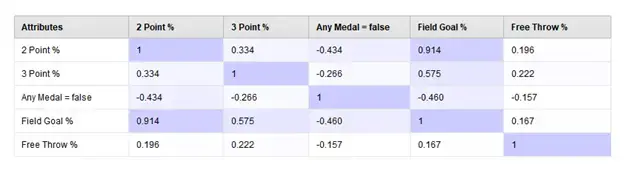 Fig 13. Correlation-Weight table of all model inputs and output.
In conclusion, we have found that a team’s ability to execute successful field goals and two-pointers in basketball seems to be the best predictor of success at the Olympics. As expected, though, there are many other factors that must be considered when trying to model a complex real-world problem, but Altair AI Studio streamlines the process of collecting, cleaning and preparing data, and the software provides all the necessary tools to jump right into data visualization and predictive modeling. Please be sure to routinely check our blog and subscribe to our YouTube channel to stay up to date on the Altair portfolio of software, tips and tricks in various tools, and real applications of simulation. As always, please reach out to us if you have any questions or comments!