
Streamlining Your Spreadsheets with Altair Monarch
Altair Monarch is a powerful tool in the Altair suite of data analytics software. It is used in a wide range of applications, such as extracting data from PDFs, turning unstructured data into structured data, and compiling multiple data sources into customizable and repeatable report templates. The abilities of Monarch extend further than this though; however, many users of the software only end up using it to acquire their information from PDFs before exporting the report to a third-party spreadsheet, when the tool has so much more to offer! Specifically, we will be looking at three ways in which Monarch can streamline your workflow before you export your reports to other interfaces, such as Microsoft Excel or Google Sheets.
Splitting Multi-Line Fields
Depending on how your input data is structured, you may end up with a field or datapoint that is multiple lines long, such as an address field, similar to the one seen in Figure 1 below. Usually, we want to store this information separately (Address Line 1, Address Line 2, City, etc.), but that can be difficult to do if the information is in our spreadsheet as one block of text.
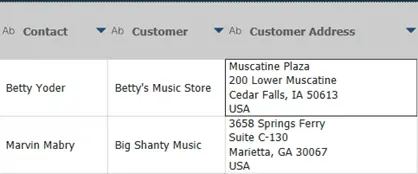
Fig 1. Table of data including a multi-line field (Customer Address) in Altair Monarch.
If we wanted to use a traditional spreadsheet tool to separate these into separate lines, we would need to create several individual formulas, and we would need to manually account for each type of address that may come up. For instance, our formula(s) must consider domestic and international addresses, and it must consider homes, apartments, or business park/suite addresses. Figure 2 displays just how lengthy some of these expressions can get just to extract a city or state value. This requires quite a tedious setup, an advanced knowledge of spreadsheet formulas, and an extremely close attention to detail, as there are plenty of opportunities to make a mistake in long formulas such as these.
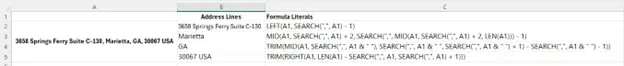
Fig 2. Multi-line field separation in a traditional spreadsheet tool showing formula literals.
Now, if we take a look at the same data in Altair Monarch, we will see that there is a much simpler approach available to us. As Figure 3 shows us, we can select a column, choose the “Split” option, and then instruct the software that we wish to split an address into its constituent parts.
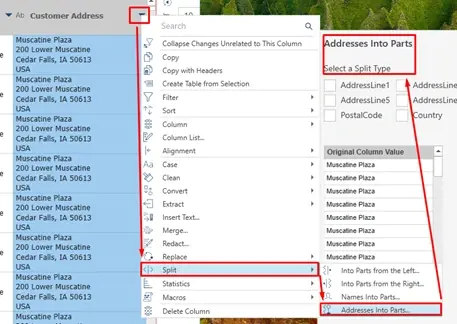
Fig 3. Accessing the Split > Address Into Parts tool in Altair Monarch.
A new window will appear, allowing us to choose the format of address we expect; effectively, we are just telling the software how many lines to break the address into and what each line means. And just like that, we now have six new columns showing each individual aspect of the original address! Figure 4 demonstrates how we achieved these results in just a few button-clicks rather than several custom lengthy formulas.
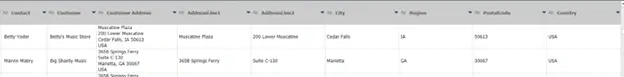
Fig 4. New Columns in Altair Monarch after using the Split > Address Into Parts tool.
Combining Data
Data scientists often need to combine structured data from various sources into one tidy report. This could either be some form of a “vertical” append, where more rows are added to a dataset, or a “horizontal” join, where more columns are added, bringing new color to the existing data. Typically, an append is more straightforward, assuming both datasets have all the same fields, so we will take a look at the potentially more troublesome horizontal joining.
Suppose we have two separate sheets of data: they both have one common characteristic between them that identifies the current row/datapoint, and they also both have one unique column describing some aspect of that row. How can we combine these two tables together and ensure that all the information stays in the correct rows? What if the data is in a different order on one spreadsheet than it is on the other? What if one spreadsheet is missing rows that the other spreadsheet has? These are all questions that give data scientists and engineers headaches regularly!

Fig 5. Joining tables of data manually in a spreadsheet.
In Figure 5 above, the data arrangement displays an example setup of this dilemma and one possible approach to solving it in a spreadsheet. Columns E and F show us the Account Number and Contact Name, while columns I and J show Account Number and Store Name, respectively. In order to form one table to accurately store all of this information, I cannot just cram these tables together and hope for the best; instead, I had to use a “LOOKUP” function to relate the tables together via the Account Number and to generate a new table housing all the data. As you can see in columns N-R in Figure 5, while we did get the desired results, this requires knowledge of these functions, and the care to use them properly to ensure accuracy.
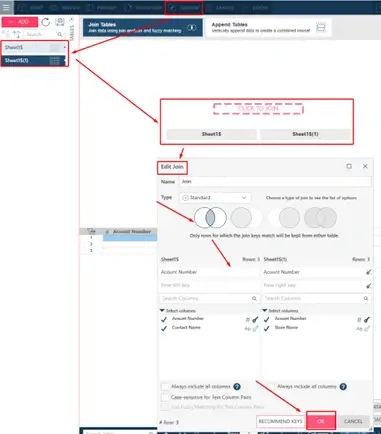
Fig 6. Joining tables in Altair Monarch.
Instead of using the messy spreadsheet approach, I can combine these data tables directly in Altair Monarch. As shown in Figure 6 above, I just need to simply drag my two datasets into the workspace, select how I want to combine the data, and select which field is the key – in this case the Account Number is the key, as it is the information that allows us to line up the data between the two datasets. Once this is complete, we get the results shown in Figure 7 below, which is a quickly and efficiently merged table that accurately combined our datasets without the need for any formulas.
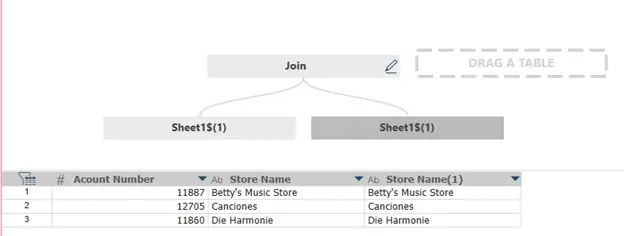
Fig 7. Result of joined tables in Altair Monarch.
Column Statistics
Lastly, sometimes the metadata, or the ‘data about our data,’ can also be valuable in certain applications. This is an extremely broad topic, but we will take a look at just a few ways of extracting this type of information. In a traditional spreadsheet, where would we even start if we wanted to aggregate our data or look at some high-level statistics? It could start with some simple summations, but eventually it would turn into a dizzying array of averaging formulas, IF statements, and potentially tricky pivot tables. With Altair Monarch, you can get a summary table of all your data, similar to the one shown in Figure 8, in just three button clicks!
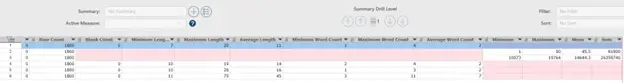
Fig 8. Statistics snapshot (summary view) in Altair Monarch.
Figure 9 below shows the clicks necessary to get to the two main types of statistical summaries available in Monarch: you will first select a field/column, then select “Statistics”, and then choose either “Create Statistics Snapshot” for a summary table like the one above or “Show Statistics” for a more thorough breakdown like the one below.
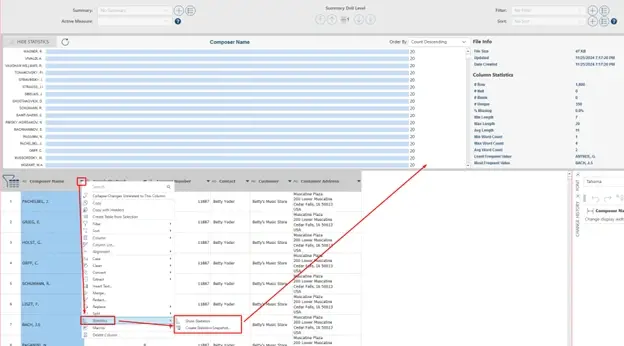
Fig 9. Column Statistics in Altair Monarch.
Either view will give you detailed insights into the structure of your data, minimum & maximum values, percentage of missing values, frequencies, and much more. Users can take this further, if needed, and drill down their summary levels and customize their active summary measurements. In brief, Altair Monarch makes it amazingly simple to acquire almost any statistical information about your data that you could possibly be interested in.
We have now taken a look at three distinct ways in which Altair Monarch can streamline your workflow when it comes to working with spreadsheets: splitting multi-line fields, combining data from various sources, and automatically extracting column statistical data. These are just a few tools to increase your data engineering efficiency in the impressive arsenal available within Monarch. Would you like to learn more about this software or more about the Altair Suite of Data Science tools in general? Then please be sure to check out our blog regularly, subscribe to our YouTube channel, and reach out to us with any questions you may have!